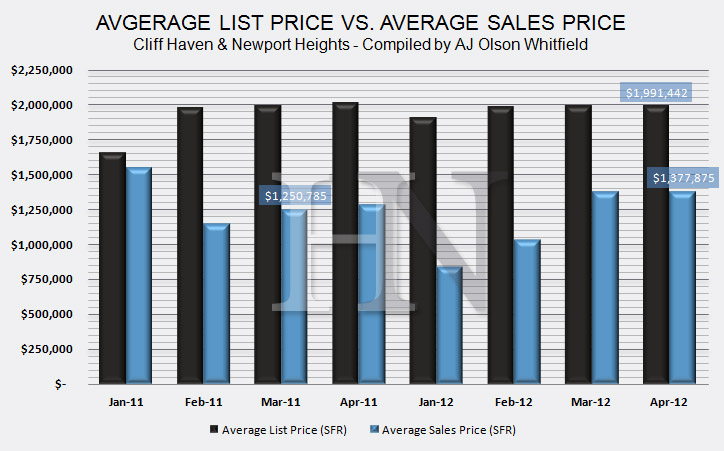
The average sales price of a home in Newport Heights and Cliff Haven has increased by 7% from April of last year, 2011 to now, 2012. The graph also depicts a 31% difference between the average list price and the final sales price in the area based on the April 2012 figures. For more information on the real estate housing market in Newport Heights and Cliff Haven contact AJ Olson Whitfield.
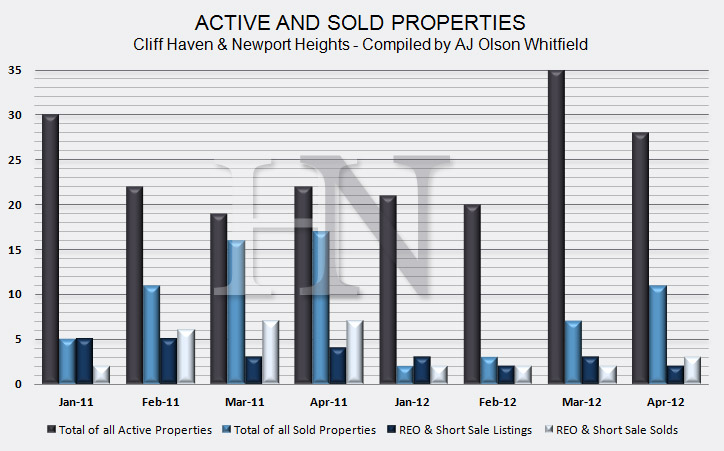
This graph shows the relationship between the total number of active listings/closed listings and REO & short sale listings/closed REO & short sale listings in Cliff Haven and Newport Heights, Newport Beach. The graph compares the first 4 months of last year, 2011 to the first 4 months of this year 2012. Compared to last year, we started out with a significantly smaller amount of properties for sale; however, the number of active listings has jumped back up through March and April. Last year, by the end of April we had a total of 17 sales in the area; this year we have 11 closed sales. For more information on the real estate housing market in Newport Heights and Cliff Haven contact AJ Olson Whitfield.
Homes for sale in Cliff Haven & Newport Heights
[idx-listings linkid=”211888″ count=”20″ showlargerphotos=”true”]


